2a. Coverage#
Determine what current threat coverage looks like and what needs the most attention. Approaching coverage should go beyond simple categorical completeness. It should try to overlay and pivot against multiple sources of discrete classifications beyond just using ATT&CK for TTP’s. There are additional considerations for overlay detailed below. Essentially, the idea is to attempt to take an adaptive taxonomical approach. The word “coverage” is often overloaded within industry lexicon and how it is interpreted is far from agreed upon. The best way to think of it in this context is some type of layered protection within your defensive posture, organized in some logically categorical manner.
Below, we will explore some of the most common sources to determine coverage.
TTPs: ATT&CK#
Have an understanding of attacker tradecraft, including tactics, techniques, and procedures (TTPs) as it relates to your environment and threat surface. From previous steps, good asset inventory, network topography and architecture, and a good baseline of environmental data can be cross-referenced with sources like MITRE ATT&CK to determine the most applicable threats, in a categorical manner.
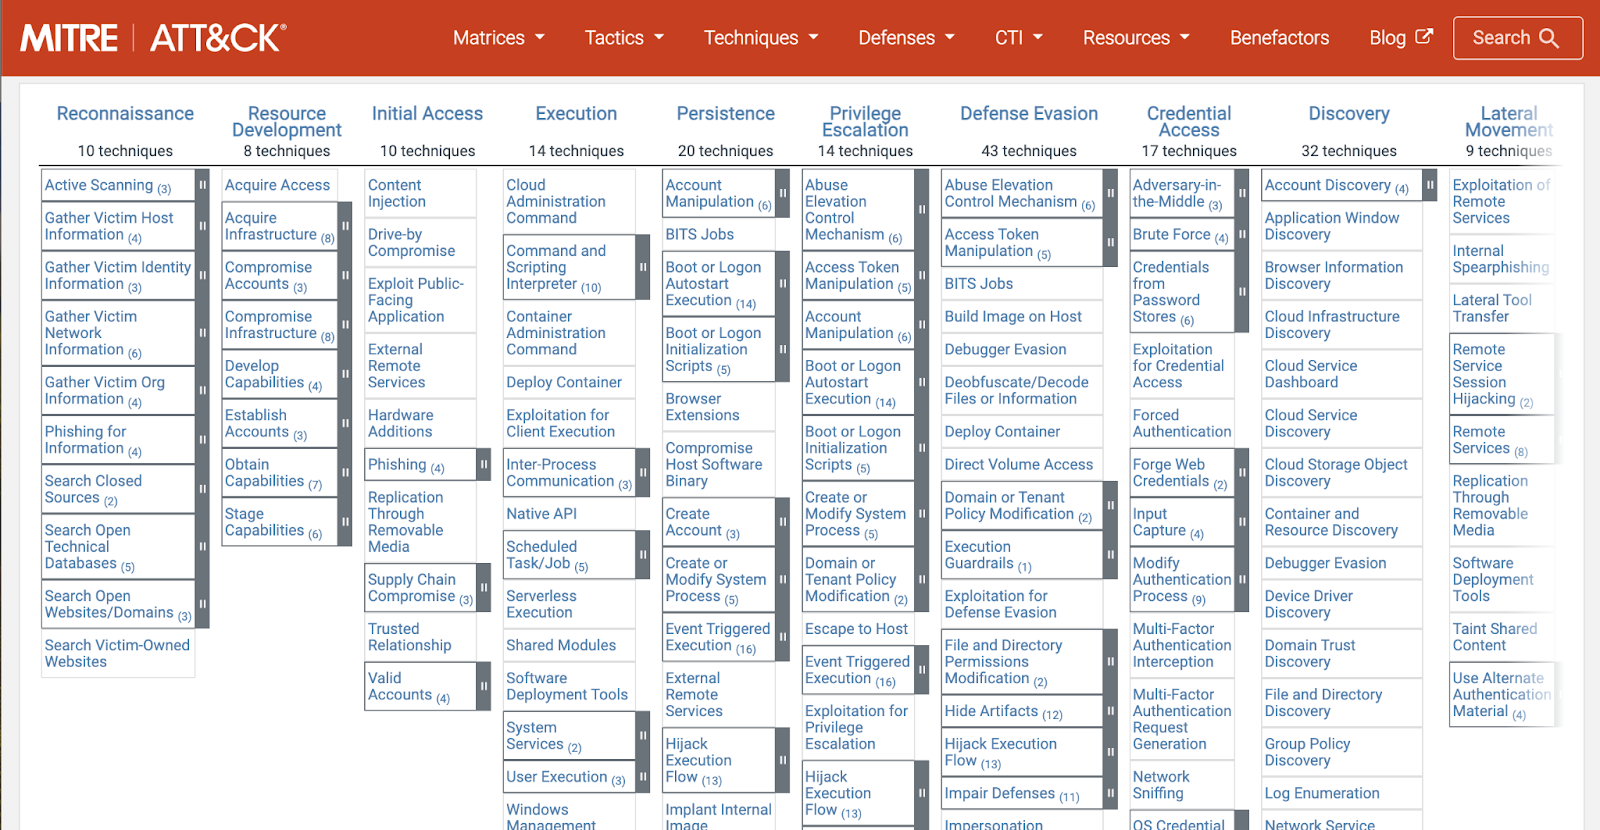
Fig. 19 Mitre ATT&CK for enterprise#
It is also helpful to view the ATT&CK matrix interpreted through applications of it within research or rules. As an example, you can view the navigator views for Splunk or Elastic SIEM and EDR rules. By looking at the details of the various applied uses of ATT&CK, you really start to see the value of the various perspectives and expertise.

Fig. 20 ATT&CK navigator breakdown for Splunk rules#
Caution
Detection engineers should not be overly reliant on MITRE ATT&CK as an exhaustive representation of coverage or TTPs. It is tempting and unfortunately far too common to see organizations determine their risk mitigation based solely on their coverage as determined by checking off squares in the ATT&CK matrix. This is why we explore multiple sources for determining coverage in this section.
Telemetry: data prevalence and usage#
Telemetry is immensely powerful for this process, as it gives us the ability to determine how rules and capabilities are performing, how they are being adopted, and how we can tune them to be more effective. It also allows us to peer into the magnitude of resulting alerts, which conveys the realistic prevalence of threats. In this case, telemetry can be actual alerts, raw events, or metrics and metadata on security artifacts. It also reveals what is not generating any data, possibly conveying gaps in data sources or detection approaches.
Event categorization: event.category#
This is dependent on the schemas used for data and how the respective data is shaped, however, looking at data sources from a categorical perspective, that is, within the data itself, will provide a sense of coverage based on relative overlap with the focus of rules, research, and other capabilities.

Fig. 21 Elastic Common Schema (ECS) categorization fields#
Data sources: endpoint, packetbeat, aws integration, CrowdStrike integration#
This is the focus across the various data sources, both deployed in your environment, but also based on what is available. Exploring security product inventories, such as Elastic Fleet Integrations provides a good sense of what is popular and commonly used.

Fig. 22 Snippet of available Elastic Integrations commonly used for security use cases#
Platform/OS: Windows, Linux, Debian, Ubuntu#
Looking at coverage from an OS perspective is also very interesting. It is no secret that Windows tends to get a lot more attention and support from security vendors, but it can also be dependent on the intent and approach of the security product. Reviewing threat coverage for a given OS relative to its representation within an environment can emphasize where attention should be prioritized.
Infrastructure/cloud: AWS, GCP, kubernetes, docker#
Similar to OS, looking at it from an infrastructure perspective also provides similar insights.
Technology: hardware, software, application#
Just like OS and infrastructure, considering the technological level also gives an interesting perspective to consider.
Applications: web servers, electron based apps, collaborative chats#
Breaking down coverage at the application level such as web applications, web clients, or client-based chat programs provides one of the most valuable, but challenging perspectives when it comes to determining coverage for priority planning.
Fields: exhaustive usage of unique logical fields, by source#
This is an interesting and less discussed approach, although the value of this may be sensitive to the maturity of the data sources and schema normalization. Comparing available raw eventing down to the query logic field level within rules and signatures that leverage them may also reveal insightful opportunities or needs.
The REx: Rule Explorer project provides phenomenal insight and ability to review rule coverage by fields, broken down across various other rule properties, as well as trend analysis of fields over time.

Fig. 23 REx: Rule Explorer breakdown of query logic field usage across rule sets#

Fig. 24 REx: Rule Explorer breakdown of query logic field usage by technique and category#
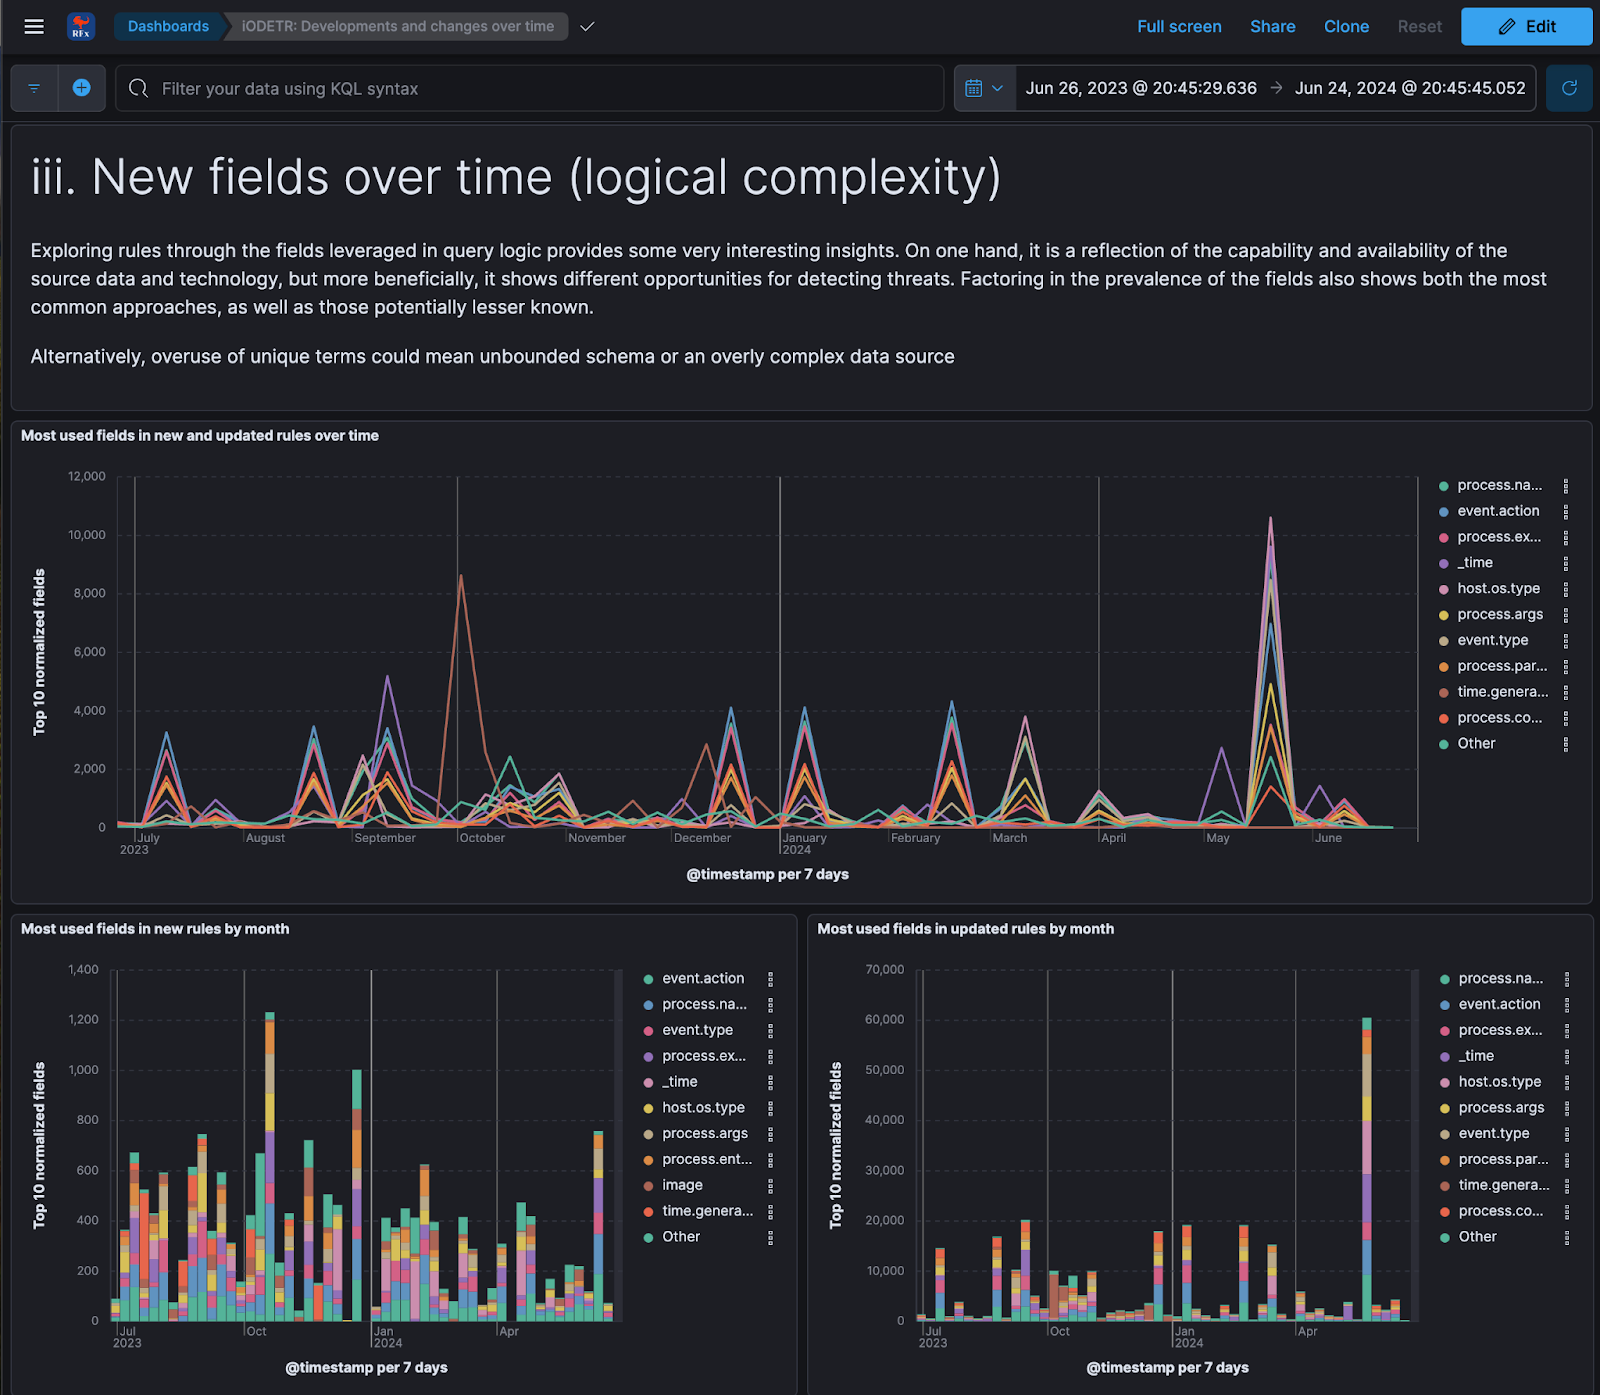
Fig. 25 REx: Rule Explorer trend analysis of query logic field usage over time#
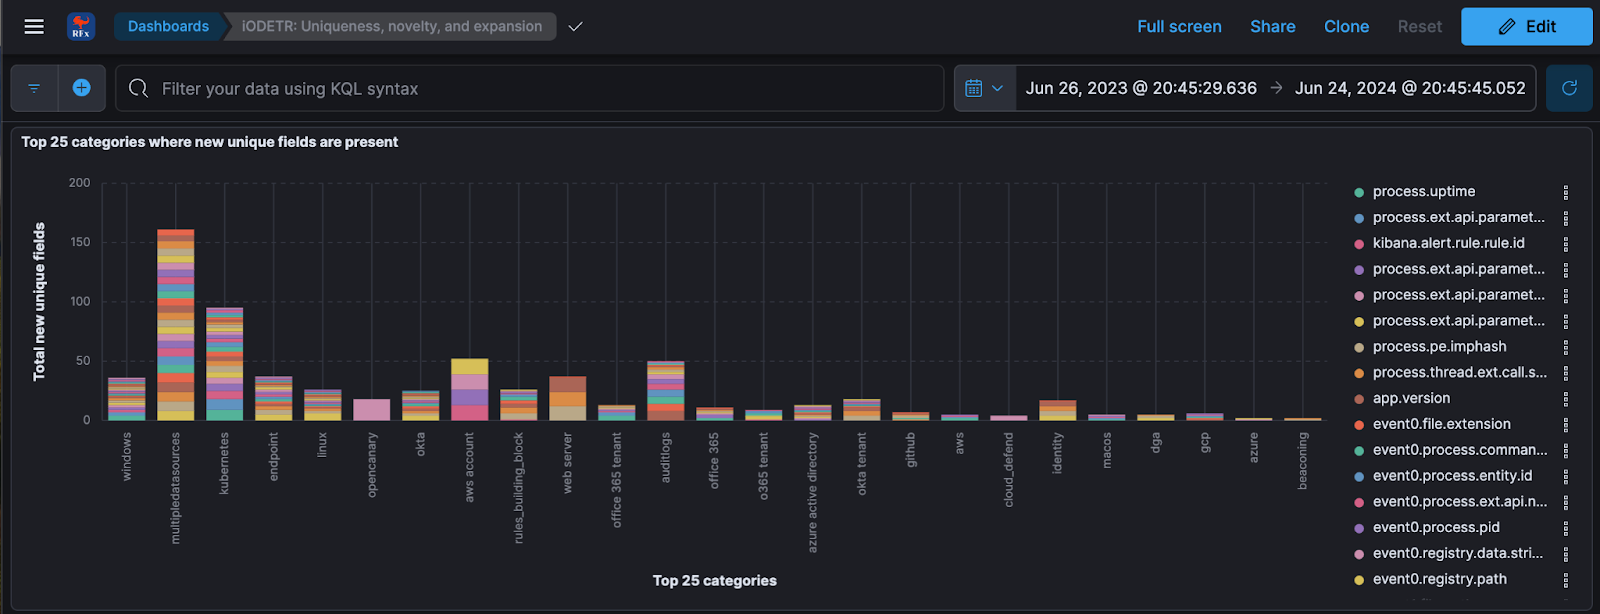
Fig. 26 REx: Rule Explorer breakdown of query logic field usage rarely seen by category#
Industry comparative analysis#
This simply means comparing to similar and dissimilar organizations, vendors, or projects, not necessarily for the sake of replication, but to also get a sense of external prioritization, scope, and distribution of efforts.